More than 5 million statistics are updated daily. From economic data to demographic figures and environmental metrics, these numbers help drive smarter decision-making. But accessing this data is often complex, and analyzing it remains a challenge.
Monitly changes that. Our platform combines AI, intuitive design, and universal access to trusted statistics — making data work simple, fast, and insightful.
What is Monitly?
Monitly is a unified platform for tracking, analyzing, and visualizing global and regional statistics. We aggregate data from the world's most important sources - Eurostat, World Bank, OECD, gov portals - and make it available in a simple, transparent, and accessible way for everyone.
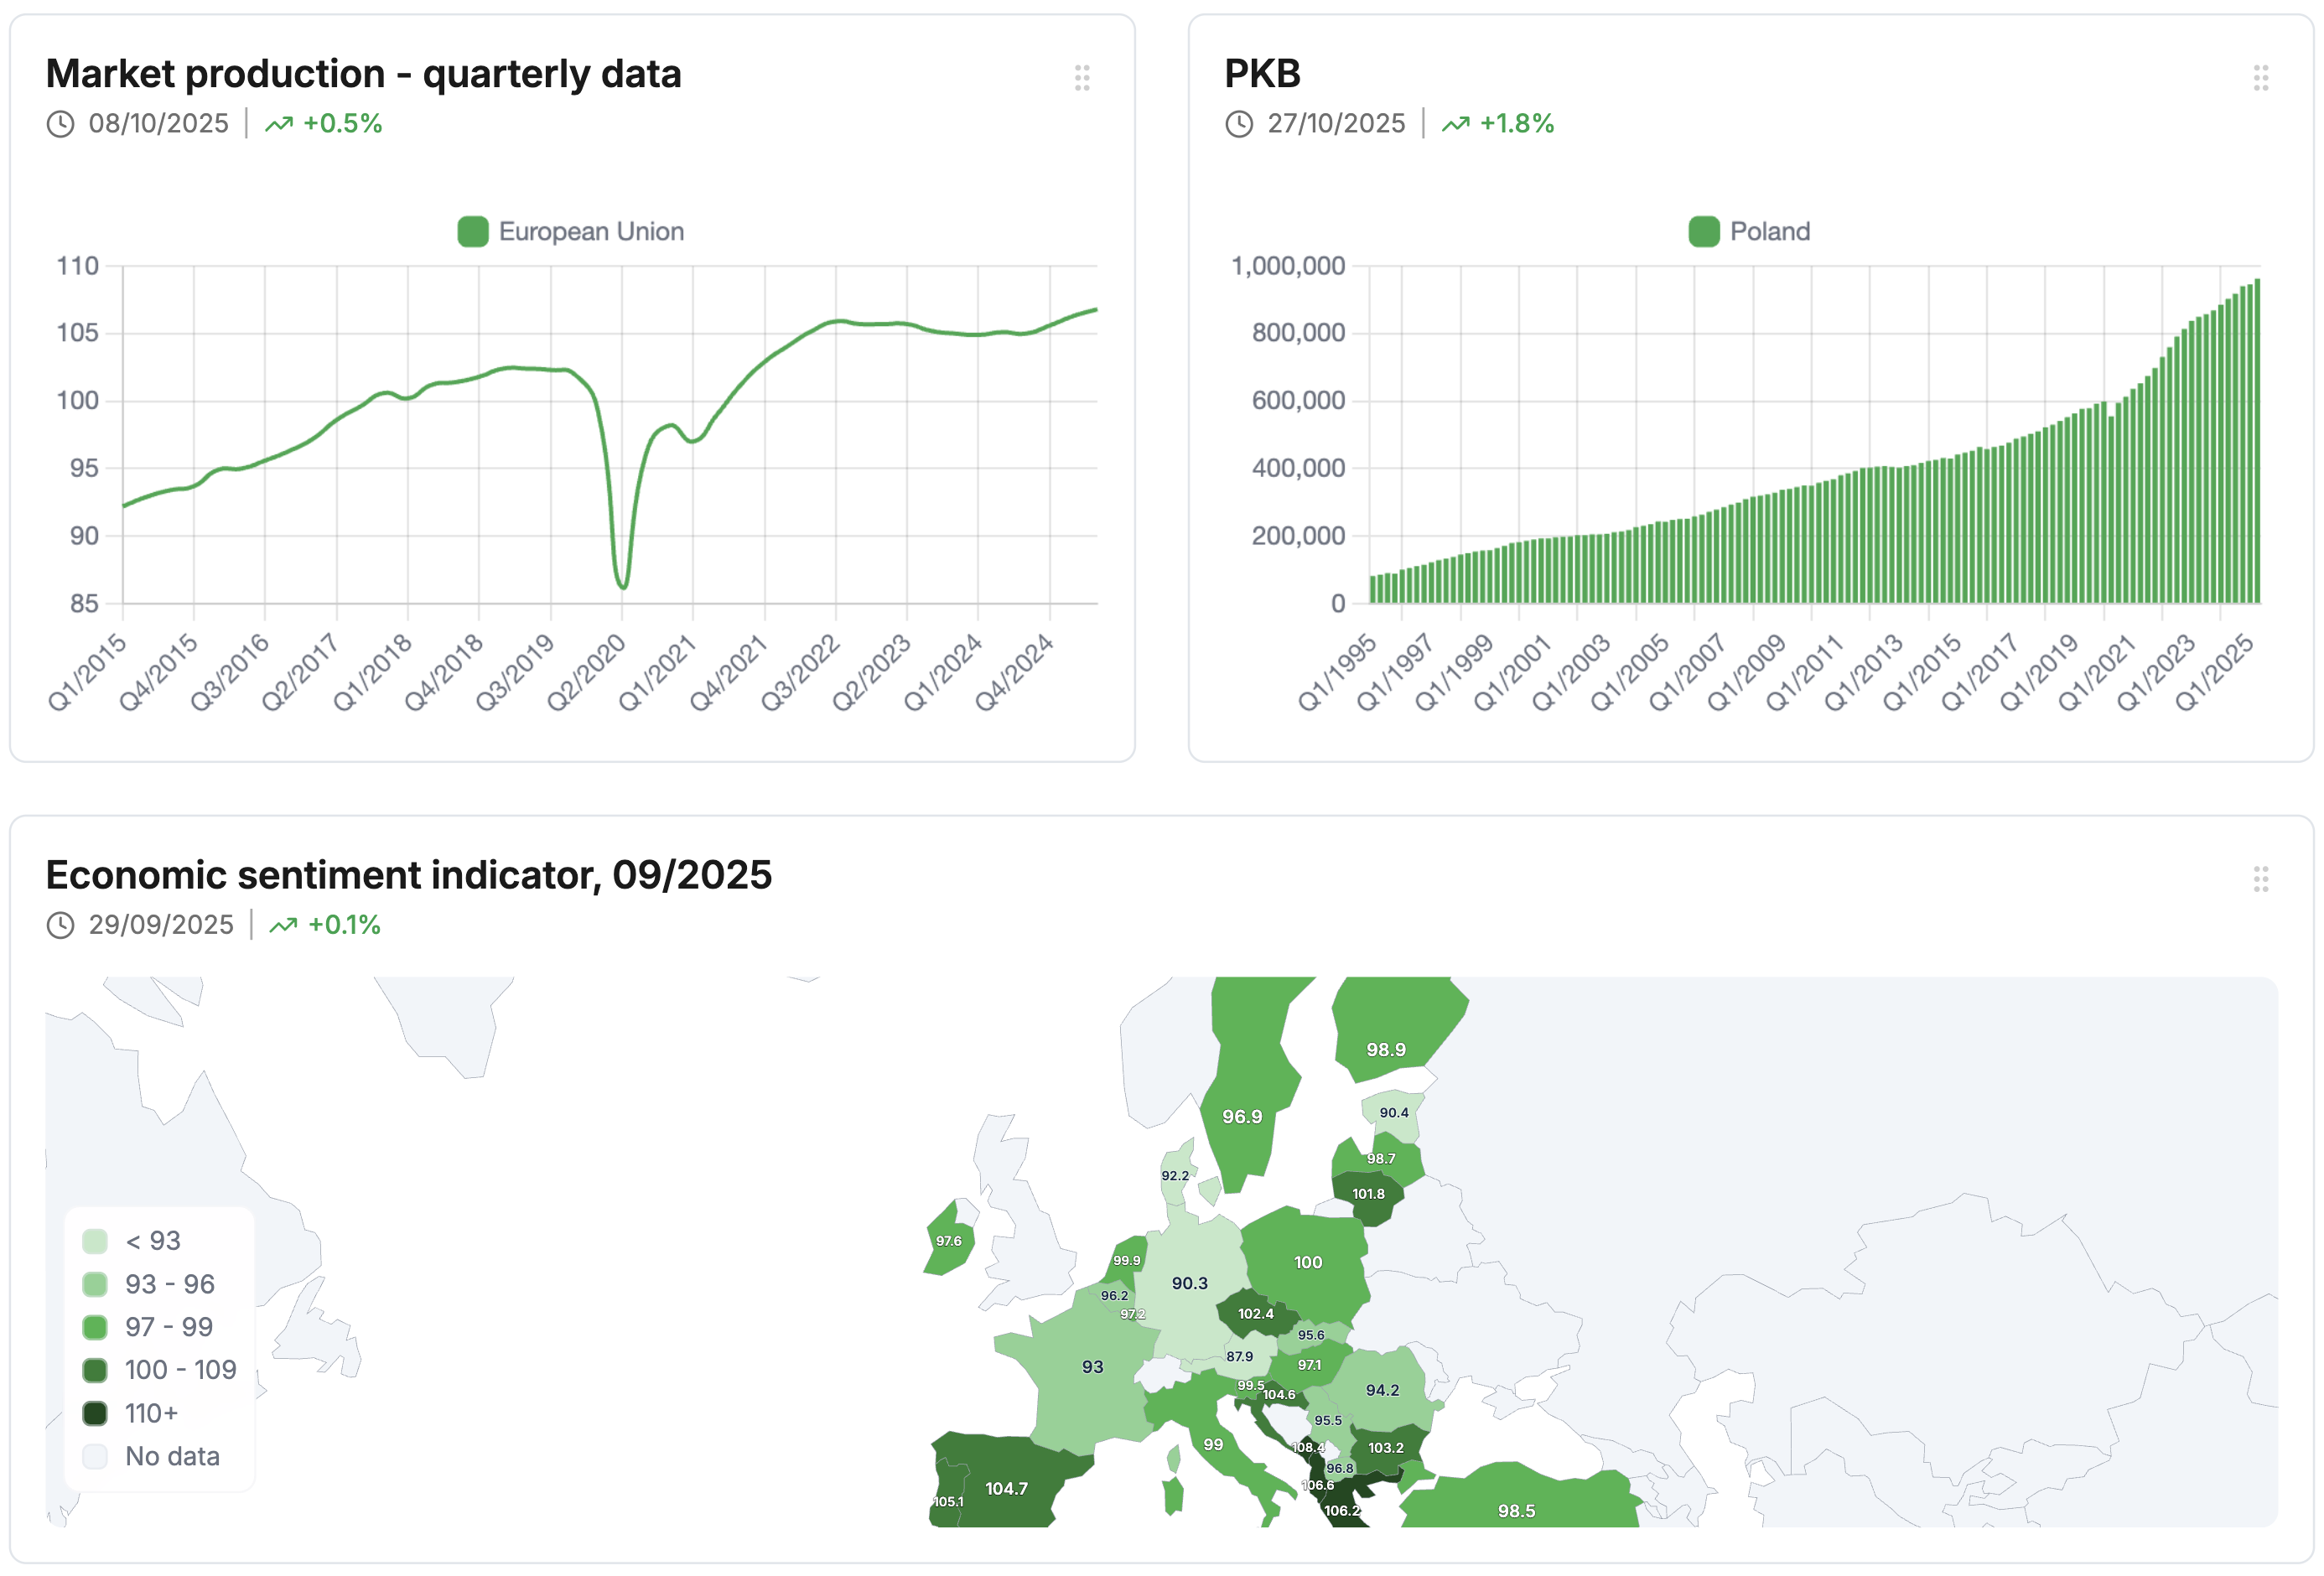
Create Smart Visualizations
Turn complex datasets into clear, interactive charts — from bars and lines to maps and tables. Each visualization updates automatically with the newest data and can be embedded anywhere.
Stay Ahead with Trend Tracking
Track key indicators with personalized dashboards and alerts. Compare current data with historical trends and stay ahead of changes.
Key features:
- Real-time data updates
- Historical comparison
- Multi-indicator dashboards
Discover with AI-Powered Research
Monitly's AI-powered Researcher can interpret natural language queries, helping you find the most relevant datasets for your needs. Simply ask a question, and the AI will suggest the best indicators, ready for you to follow with a single click.
Key Features:
- Natural Language Queries - Ask questions like: "Show me GDP data for France"
- Smart Recommendations - AI suggests related indicators you might not have considered
- Data Personalization - Automatically selects the most relevant dimensions and generates a ready-to-use chart
Watch how AI Researcher instantly finds and visualizes GDP data for France based on your natural language query.
Connect Live Data with API
Integrate Monitly's data directly into your applications with our REST API. Access millions of statistics, search datasets, and generate charts through simple HTTP requests like:
GET /api/datasets - Browse all available datasets
GET /api/datasets/{id}/ - Access data with flexible filtering by country, time period, and dimensions
POST /api/charts/generate-png - Generate high-quality chart images for reports and presentations
View Complete API Documentation →
Use Dynamic Values
Say it once and let the data keep speaking. For example, you can say “In December 2025, the annual inflation rate in the European Union is 2.3%.” That sentence stays accurate because the value is fetched directly from the live dataset every time someone reads the article. Embed a dynamic span once and your reports, newsletters, or dashboards keep themselves up to date—no manual edits, no stale numbers.
Who is Monitly for?
Students & Researchers
Find reliable sources, cite them automatically, and export data for analysis — all in one place.
Journalists & Creators
Create and embed auto-updating charts in articles. Your visuals and content always stay current — no manual updates needed.
Companies & Analysts
Monitor trends with automated dashboards and alerts. Save time with reports that refresh automatically.
Summary
For a long time, statistics were seen as something distant — academic, abstract, or purely descriptive. Today, that perception is changing. We've entered an era where data is updated in real time, institutions share it more openly, and the demand for evidence-based decisions is higher than ever.
Monitly embraces this transformation — using better tools, open data, and AI to make statistics truly useful. It helps turn numbers into understanding, and understanding into action.